

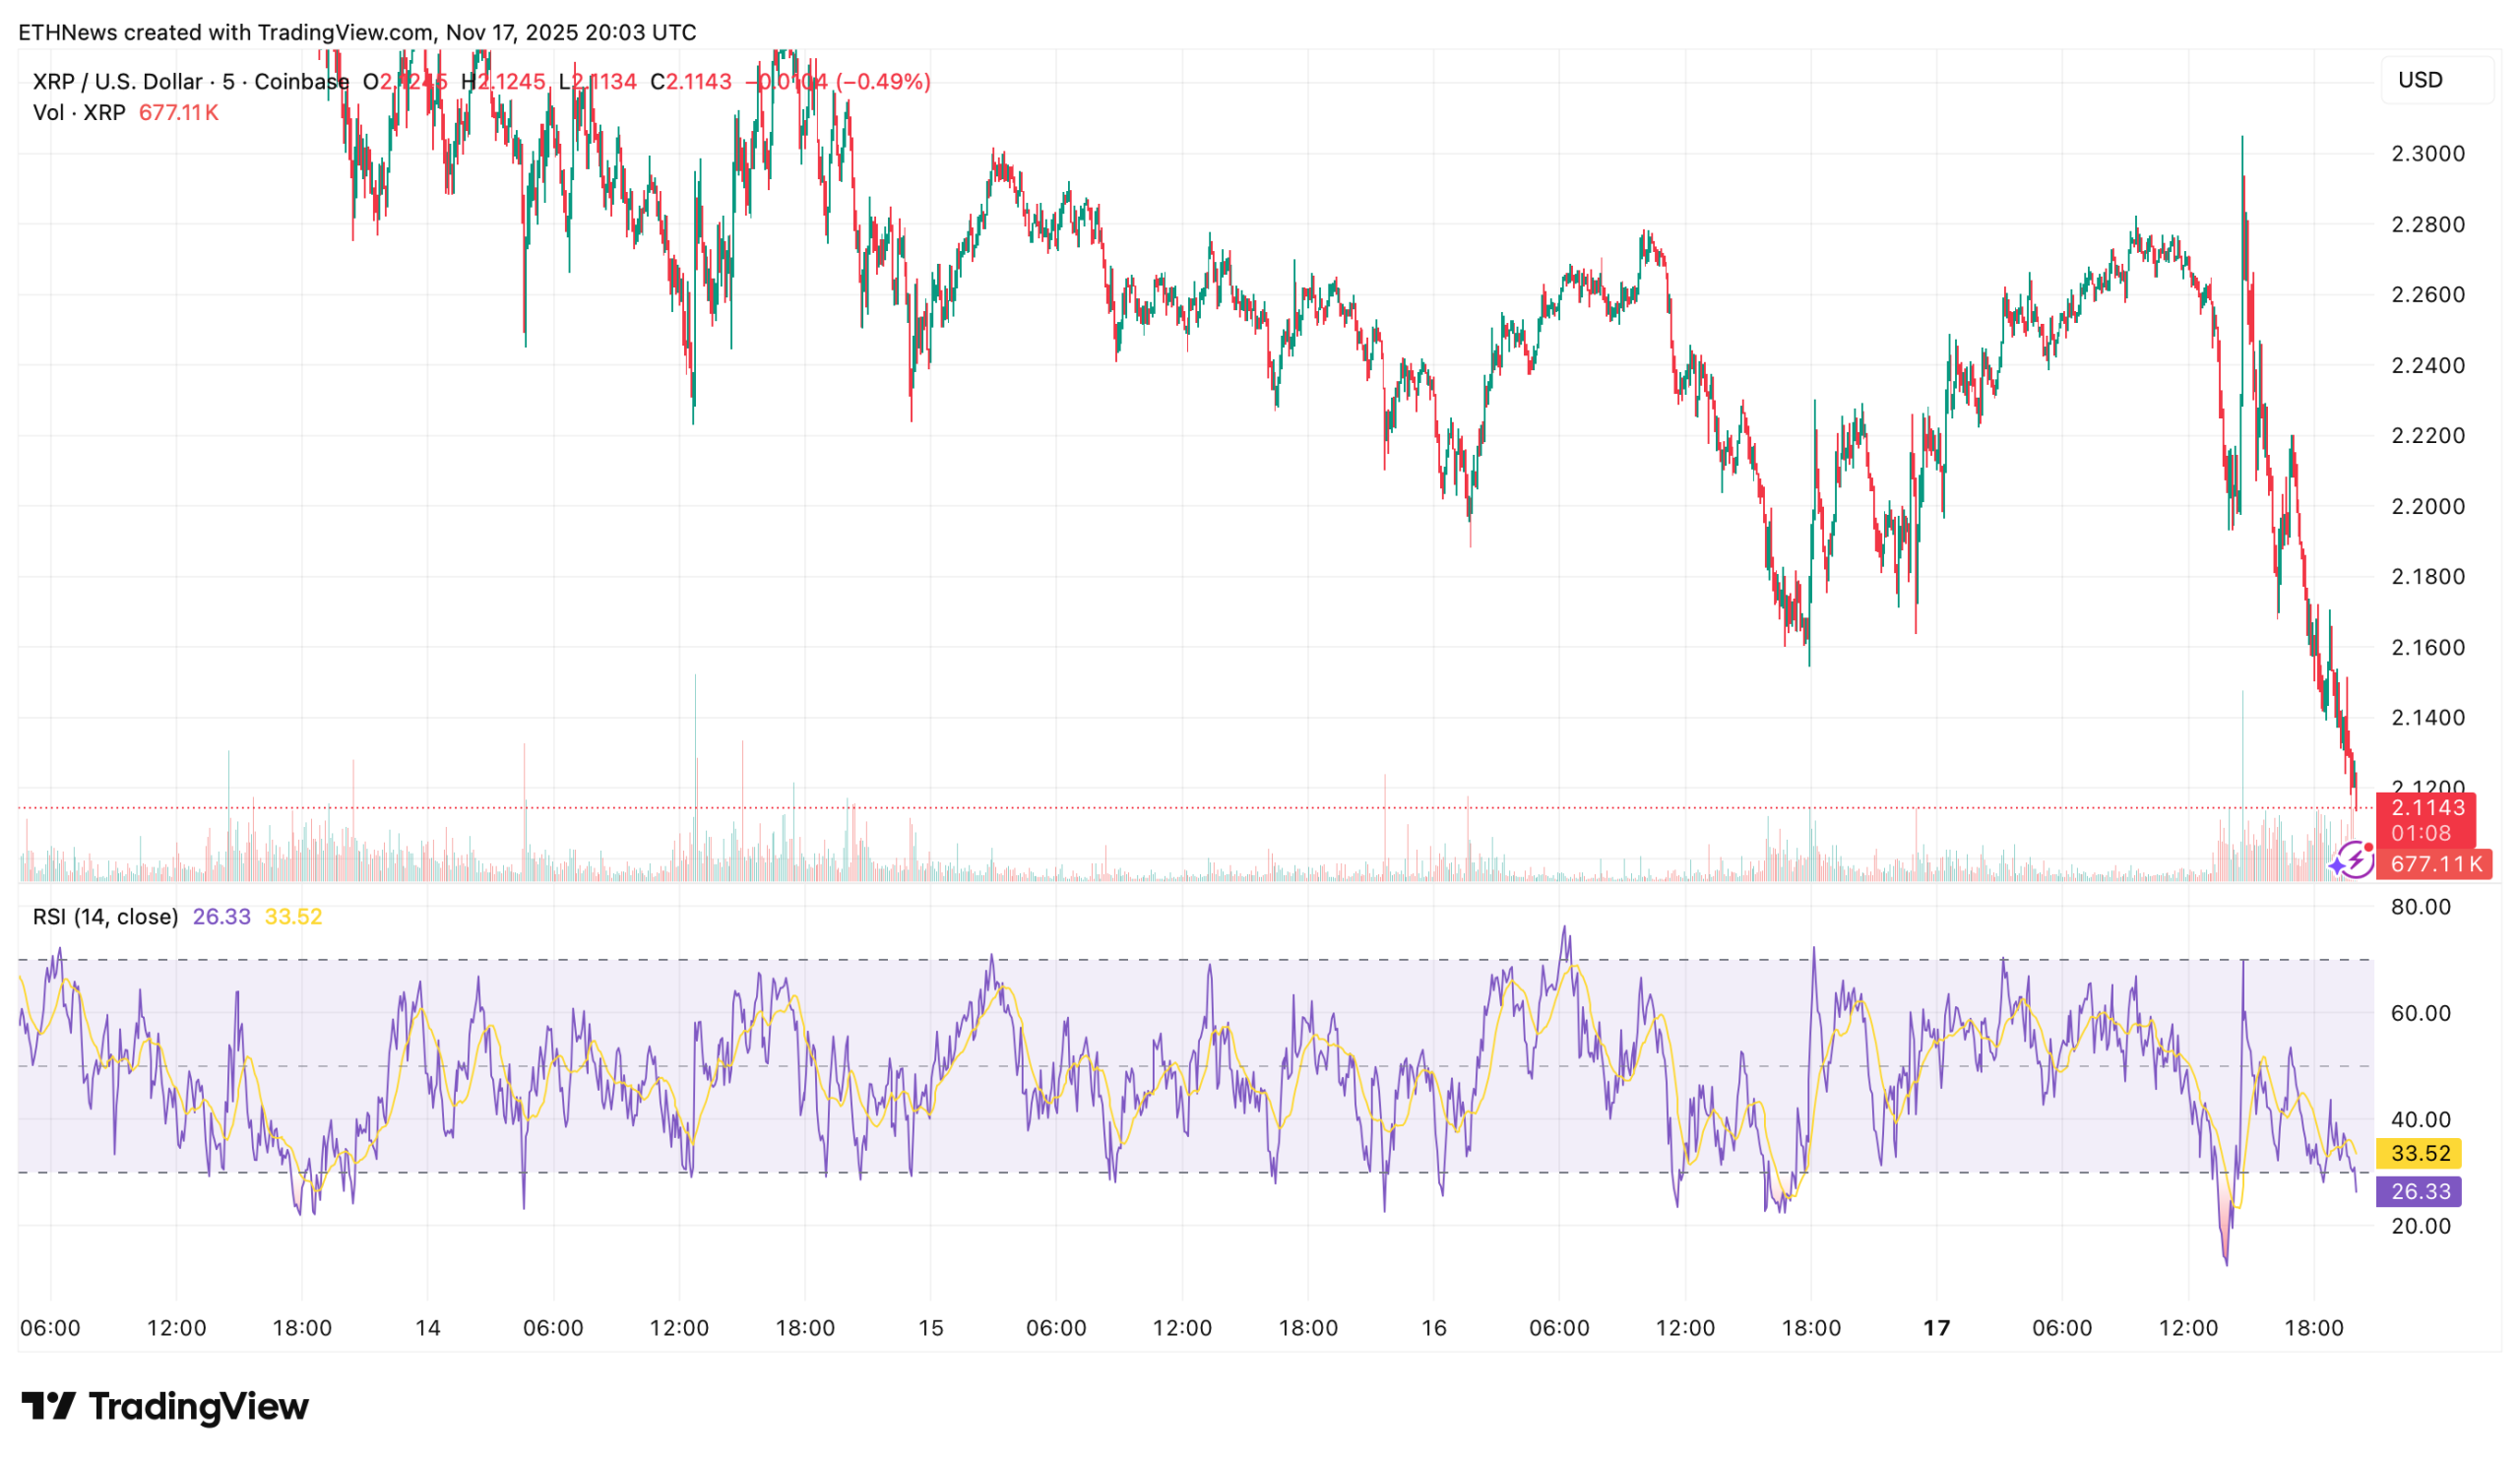
XRP extended its weekly decline to nearly 17% in the past week, falling to $2.11 after repeated failures to reclaim the $2.30 resistance zone. The level, tested many separate times since November 15, acted as a ceiling for bullish attempts, and the final rejection triggered an aggressive wave of sell-offs.
One of the clearest signals came at 14:00 UTC on November 17, when XRP recorded a 342% intraday volume spike, hitting 237 million XRP traded within minutes. Analysts attribute this to institutional-sized distribution, not retail activity.
Breaking below $2.30 immediately placed XRP under multiple critical trend indicators. The price slid beneath the 200-day EMA at $2.57, a trendline XRP has held above for most of 2025. It also lost the 38.2% Fibonacci retracement at $2.46, confirming a shift into a bearish structure.
Momentum indicators reinforce the downside pressure. The RSI has fallen to 40.24, hovering just above oversold territory, while the MACD reads -0.0057, showing strengthening downward momentum. On the lower timeframes, TradingView data reveals consistent lower highs followed by abrupt sell walls, a pattern that suggests algorithmic selling rather than organic rotation.
Market Outlook and Support Levels
With the $2.30 zone now flipped into resistance, traders are watching the next major support at $2.01. A clean hold there could provide temporary relief, but failure to defend it exposes an air pocket toward the $1.9 liquidity zone.
For now, XRP remains under pressure, with bearish technicals dominating and sentiment deteriorating in line with broader market weakness.