

Key Market Insights
- •XRP experienced short liquidations totaling $24 million, indicating significant pressure on bearish positions near the $2.00 price range.
- •Coinglass data highlights a substantial liquidity buildup around the $2.15 mark, a level that historically acts as a price magnet.
- •The long-term ascending triangle pattern remains intact, supporting the potential for a significant breakout in the future.
XRP was trading at $1.92, with its 24-hour trading volume nearing $9.44 billion. The asset has seen a 9.2% decrease on the day and a nearly 16% decline over the past week. Despite this recent downward pressure, current market data suggests a potential short-term movement towards the $2.15 level.
Significant Liquidity Cluster Forms Near $2.15
A short-term liquidation heatmap provided by Coinglass reveals a dense concentration of liquidity situated at the $2.15 price point. This zone is prominently displayed in bright yellow, indicating a significant number of leveraged positions. On November 21, 2025, at 08:00 UTC, XRP briefly reached $2.1531, with total liquidation leverage amounting to $104.65 billion.
Market participants commonly monitor these high-liquidity zones, as prices often gravitate towards them. Analyst Steph Is Crypto shared their perspective:
"$2.15 is where the liquidity sits for #XRP. Expect a move to the upside soon."
These liquidity zones can become critical levels for price interaction before a definitive directional trend is established.
Short Positions Dominate Liquidation Volume
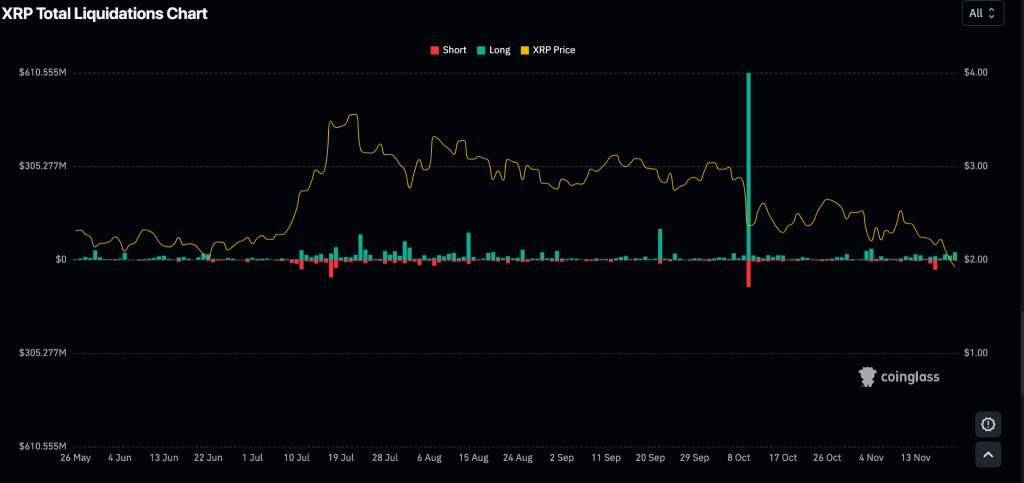
Liquidation data indicates a clear imbalance in the market. Recent figures show that short liquidations have reached $24.44 million, in contrast to $3.81 million in long liquidations. This disparity suggests that a greater number of bearish traders were caught unprepared by recent market volatility.
The chart illustrates a consistent downward trend for XRP since mid-September, represented by the yellow line. Red bars, denoting short liquidations, appeared during price surges, indicating that downward price movements are experiencing occasional squeezes. Long-side liquidations have remained limited, implying a degree of caution among bullish traders.
This liquidation pattern could signify a shift in market sentiment, particularly if the price tests resistance levels near $2.00 to $2.15 in the immediate future.
Long-Term Chart Structure Remains Intact
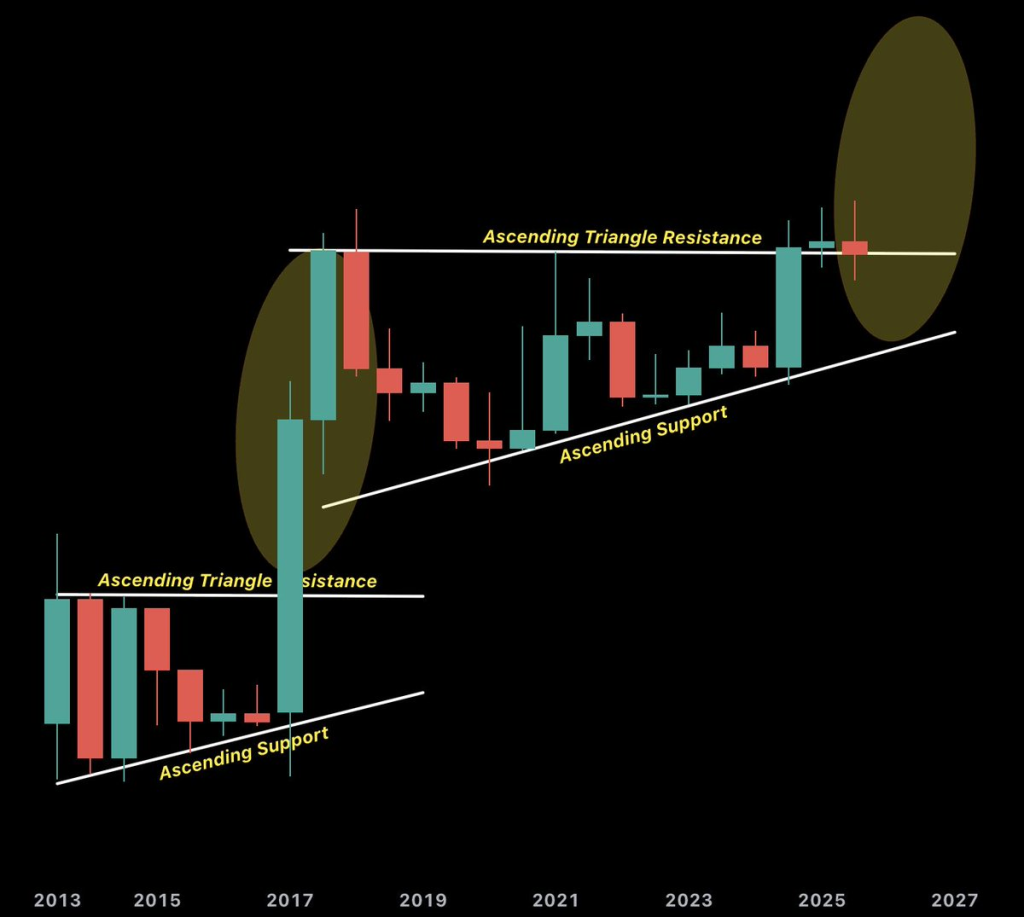
Chart data from ChartNerdTA reveals that XRP is maintaining its position above long-term ascending support. This forms a structural pattern reminiscent of the 2013–2017 market cycle. The current configuration has been developing over several years, consolidating within an ascending triangle pattern, characterized by consistent flat resistance capping upward price attempts.
The analyst noted, "Same structure, different cycle." The chart suggests that XRP is following a comparable macro setup to previous cycles. As long as the price remains above its support levels, this long-term structure is expected to persist.
The asset is currently approaching a juncture where both short-term liquidity dynamics and long-term structural patterns may converge. The ability of the price to reclaim higher levels beyond $2.15 will be contingent on broader market trends and demand at these key price points.