
The XRP price experienced a 3.6% decline in the last 24 hours, trading at $2.18 as of 3:45 a.m. EST. This movement occurred alongside a significant 66% surge in daily trading volume, reaching $7.27 billion.
This price action unfolds as anticipation grows for the launch of four new spot XRP Exchange Traded Funds (ETFs) scheduled between today and November 25. Franklin Templeton’s EZRP ETF is slated to be the first to launch.
The Clarity Act: You're gonna see hundreds of millions, probably hundreds of billions of dollars, perhaps even trillions of dollars flowing into digital assets!
7 #XRP ETFs to be launch this month! pic.twitter.com/vnI8s5b7qg
— Skipper | XRPL (@skipper_xrp) November 18, 2025
Despite the recent dip, investors are expressing hope that the upcoming ETF launches could catalyze a turnaround for the Ripple token. However, some market analysts caution that XRP might experience further downward pressure before buyers step in.
🚨WHY IS XRP FALLING EVEN AFTER THE SUCCESFUL LAUNCH OF THE XRP ETF?
Canary Capital’s $XRP ETF saw strong early demand, but whale selling and market weakness pushed XRP down 11%.
Despite the massive inflows, XRP’s price has declined around 11% since November 13. The markets… pic.twitter.com/mx4jVEZDKE
— Skipper | XRPL (@skipper_xrp) November 18, 2025
XRP Price: On-Chain Action Signals Potential Change
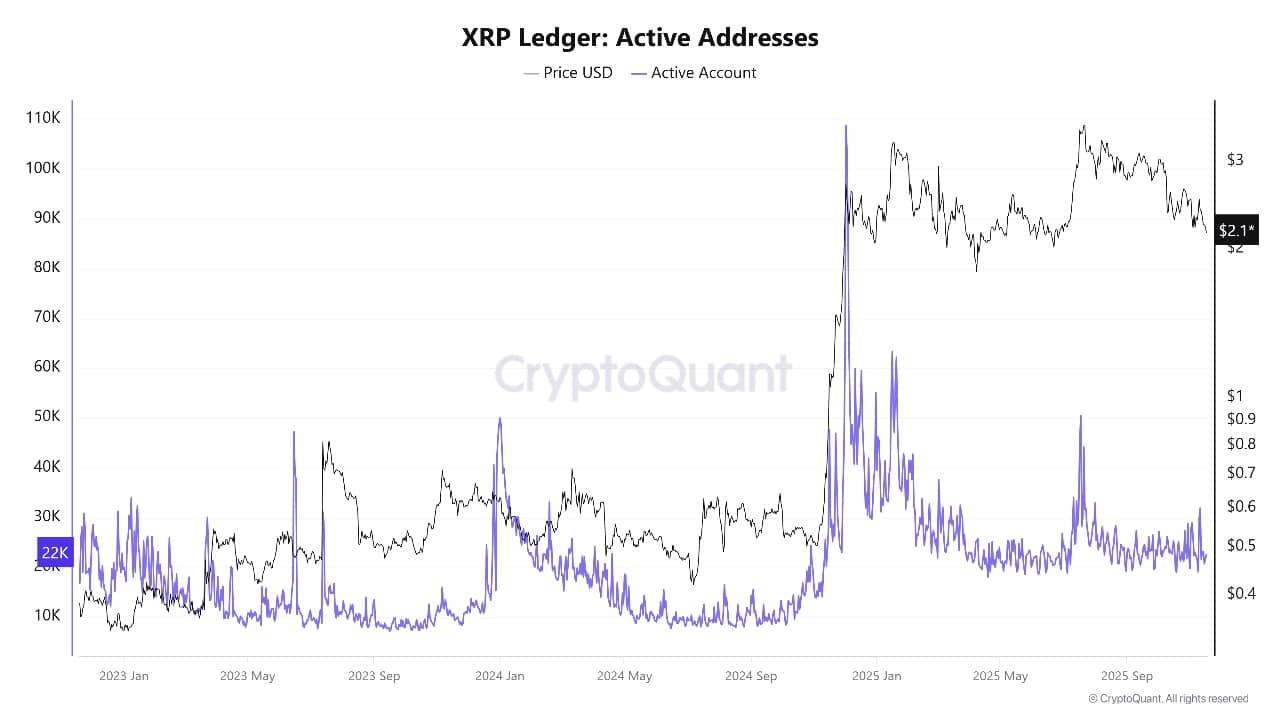
The XRP price has shown increased whale activity and rising interest on-chain, even as the price has seen some selloffs. Last week, whales were observed moving millions of XRP across various wallets, suggesting adjustments to their positions in anticipation of the ETF launches.
Furthermore, active addresses have also seen an increase, indicating that traders and investors are actively preparing for potential market shifts.
Despite the recent negative price trend, the ongoing selloffs have not entirely dampened market activity. Network volumes have risen, with reports indicating that over $250 million flowed into XRP ETFs prior to their official launch. This demonstrates significant institutional interest, even amidst volatile market conditions.
Many long-term holders are maintaining their positions, while some short-term traders have opted to take profits. Large investors and funds are also increasing their holdings, anticipating potential price appreciation as the new ETFs introduce fresh demand.
However, sentiment remains mixed. Some investors believe that prices could decline further before all four ETFs are launched, drawing parallels to the price patterns observed with Bitcoin and Ethereum ETFs. Conversely, others point to new inflows and consistent network activity as indicators that demand could recover swiftly.
XRP Price Support Zone Holds Strong
The XRP price is currently situated just above a critical support zone, ranging between $2.16 and $2.00. This area is significant as it represents a capitulation low established during recent selloffs.
Key technical indicators suggest a cautious outlook, though not an immediate panic. The Relative Strength Index (RSI) is at 41.82, indicating that XRP is approaching oversold territory. A further decline in RSI towards 30 could signal the return of buyers, a pattern observed earlier this year.
The 50-week Simple Moving Average (SMA) is now positioned higher at $2.53, while the 200-week SMA continues to provide support at $1.05. XRP is trading below the shorter-term SMA but remains well above the longer-term SMA, suggesting that while the medium-term trend is showing signs of weakness, the longer-term trend remains intact.
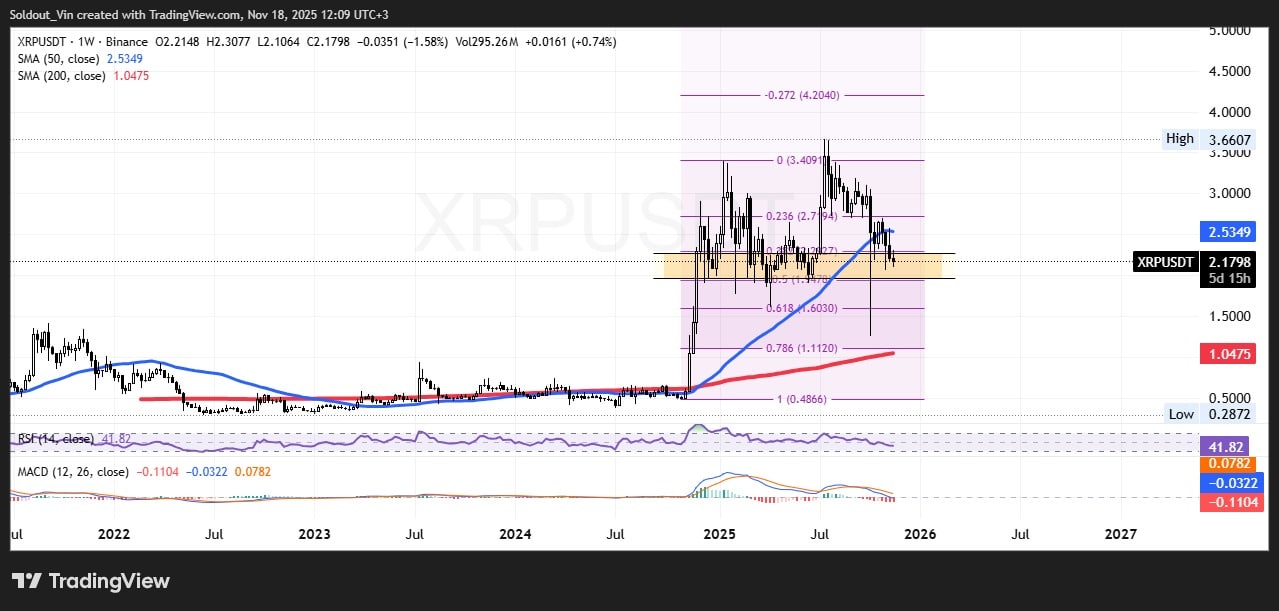
The Moving Average Convergence Divergence (MACD) indicator is currently negative at -0.11, with the signal line (orange) positioned slightly above the MACD line (blue). This suggests a slowing momentum rather than a sharp decline.
Current price action indicates XRP is trading within a range. If buyers successfully defend the support zone between $2.16 and $2.00, a rebound to test resistance at $2.54 could occur. A sustained break above this resistance level might pave the way for a move towards $2.77, which corresponds to the 0.236 Fibonacci retracement level, and subsequently towards $3.40, aligning with previous rally peaks.
Conversely, if sellers gain control and XRP falls below the $2.16 support level, the price could rapidly descend to $2.02 or even $1.88, where the next significant buying zones are located.
Such a downturn would echo the price patterns observed during previous ETF launch periods. Nevertheless, traders remain optimistic, anticipating a potential reversal as the new ETFs introduce additional liquidity and attract new buyers.
For the present, if the support levels hold and the ETF launches proceed smoothly, the XRP price may see a recovery.