

XRP is currently under pressure, characterized by negative funding rates and an increase in short interest. Concurrently, on-chain velocity has reached its highest point this year, signaling active token movement. Technical indicators suggest weak momentum, with resistance observed near the $2.25 to $2.35 range.
At press time, XRP was trading at $2.13, having declined by 1.3% in the past day. This marks an extension of a week of consistent weakness, resulting in an approximate 3.5% decrease over the period. The token is now trading approximately 40% below its July high of $3.65.
Market activity appears to be cooling, with daily XRP spot volume falling by 27% to $3.41 billion. This decline indicates that traders are reducing their exposure as momentum slows.
Short Interest Expands as Funding Turns More Negative
Data shared by CryptoQuant contributor PelinayPA on December 3rd indicates that funding rates have remained negative for several consecutive days and are continuing to deepen into negative territory. The prevalence of short positions over long positions is contributing to the directional pressure already evident on XRP’s price chart. This environment has limited upward price movements, as buyers are not establishing positions with strong conviction.
PelinayPA noted that the current market setup increases the likelihood of XRP revisiting the $2 to $1.9 zone. While a significant short squeeze does not appear imminent, a further decline in funding rates could potentially lead to a brief upward movement in XRP towards the $2.25–$2.35 range as short positions are compelled to close.
In a separate analysis, CryptoOnChain revealed a sharp increase in XRP velocity on December 2nd. The metric, recorded at 0.0324, has climbed to its highest level of the year, signifying active on-chain movement and rapid circulation of the token. This suggests that XRP is being utilized more intensively than earlier in the year, with both traders and large holders transacting coins at an accelerated rate.
XRP Price Technical Analysis
On the daily chart, XRP remains confined within a distinct downward trend structure. The current price is below the 50-, 100-, and 200-day moving averages, indicating that momentum has not yet shifted to a positive trajectory. Although the 20-day moving average is situated close to the current price, it has not yet turned bullish. This maintains the broader trend in a downward direction, suggesting that a substantial rebound is unlikely in the near term.
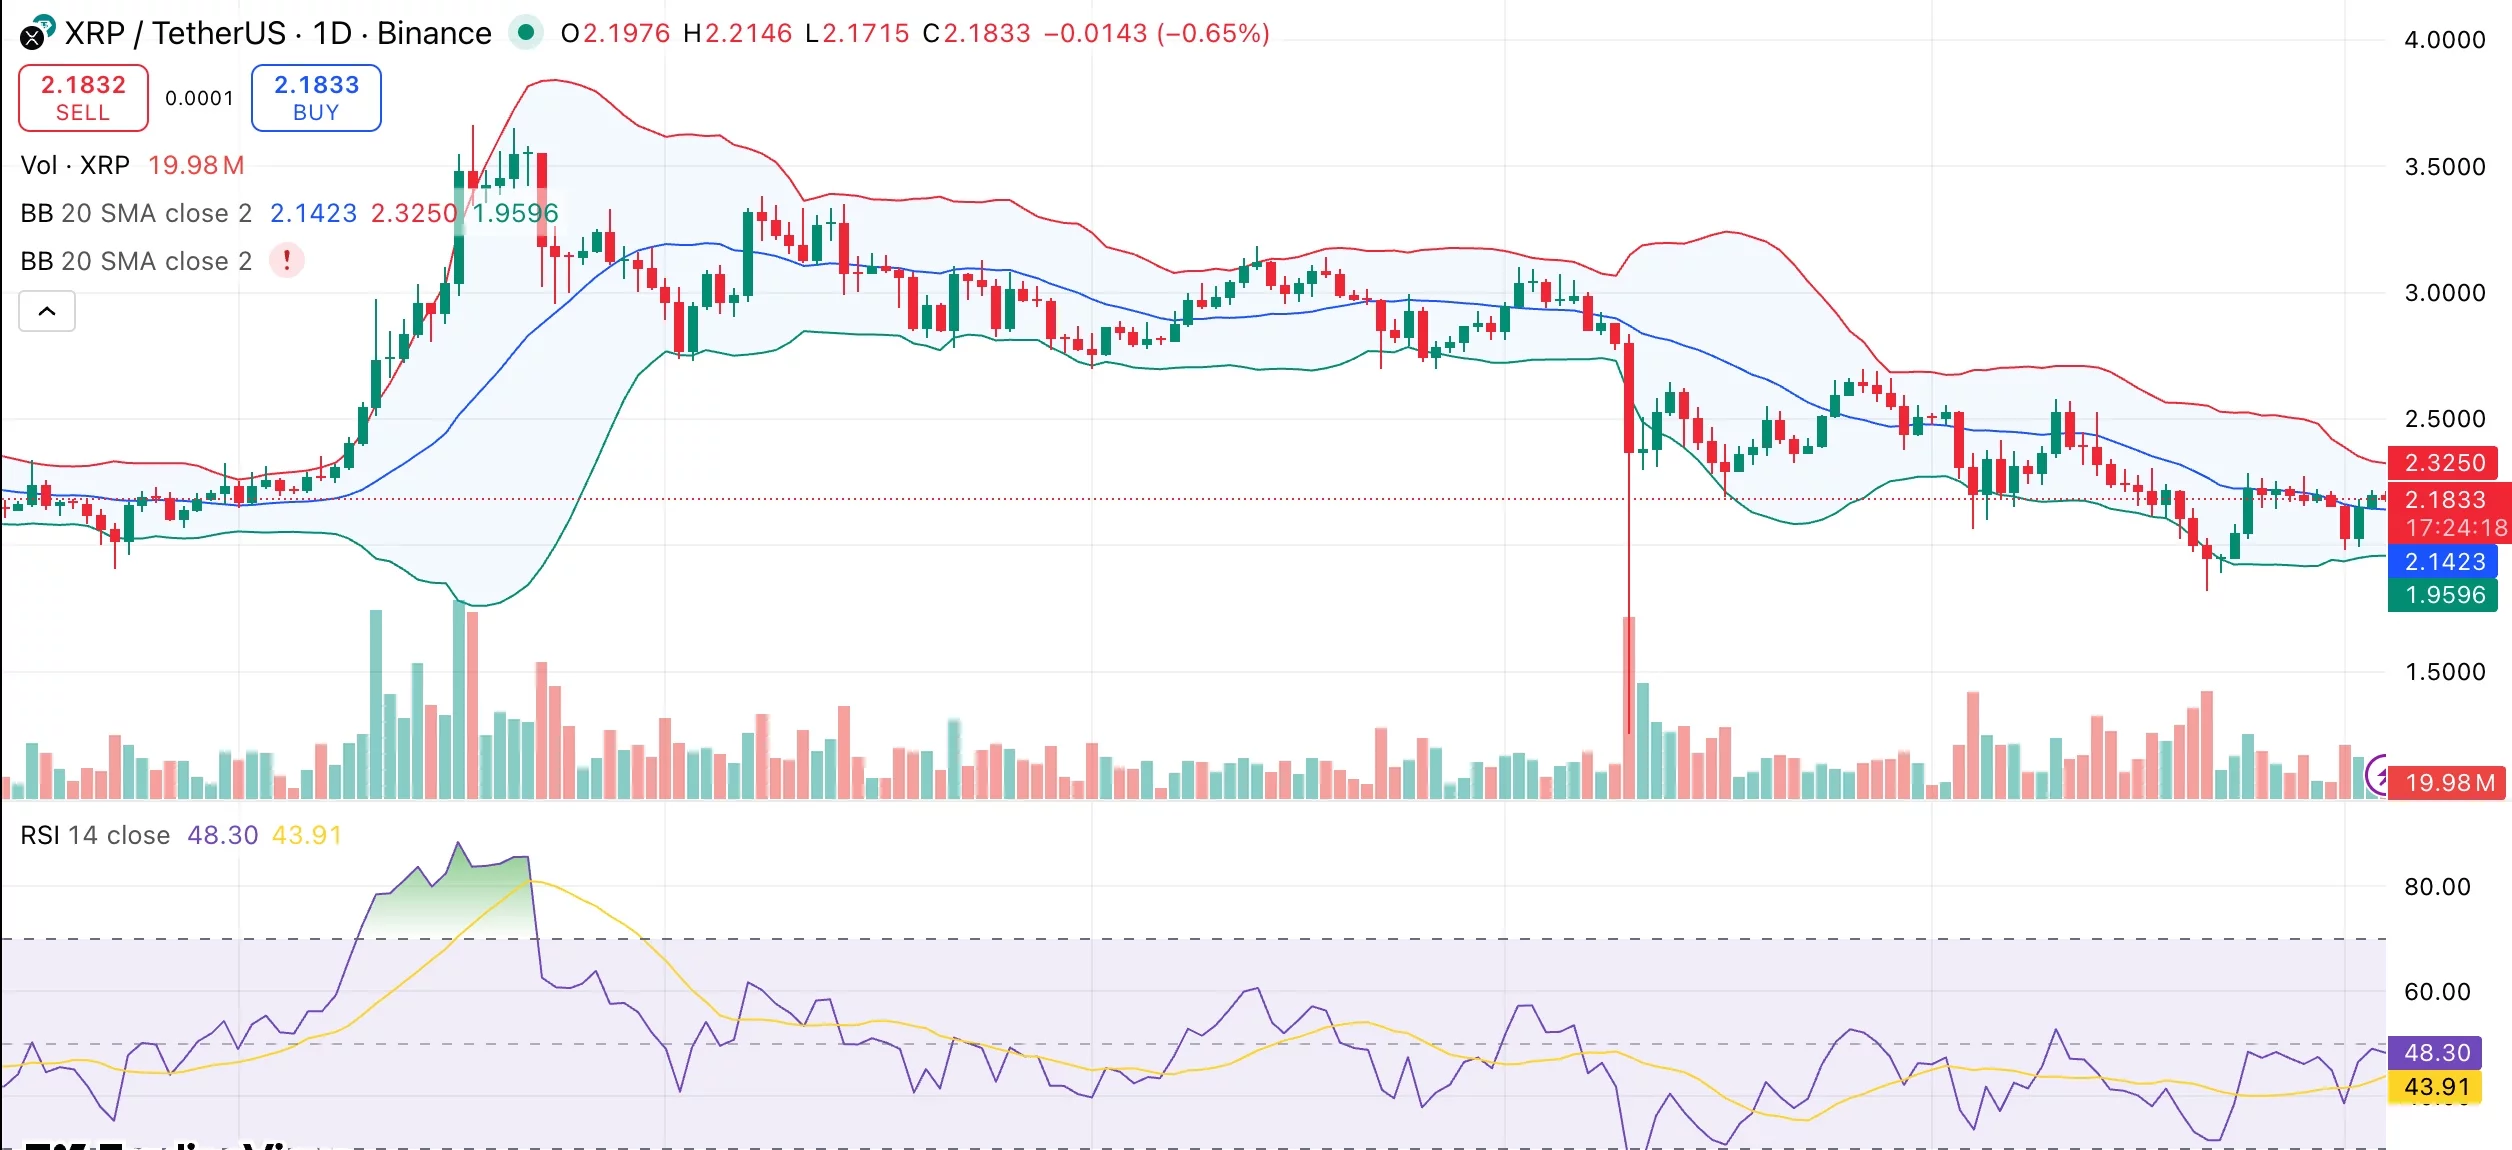
Volatility has decreased, as evidenced by the relatively narrow Bollinger Bands. The price encountered difficulty breaking above the upper band and is now drifting near the middle band. Should selling pressure persist, the next significant level to watch will be the lower band, which is situated near $1.96.
Momentum indicators are presenting conflicting signals. While the MACD suggests an early bullish crossover, this signal remains weak. The relative strength index (RSI) has maintained a neutral position, hovering around 48.
Key support levels are identified at $2 and subsequently at $1.9. Resistance is located near $2.25, followed by $2.35. A clear break above the upper Bollinger Band would serve as the initial indication of renewed strength. Conversely, a drop below $2 would likely attract another wave of short selling activity.