

The XRP price experienced a 3% decline in the past 24 hours, trading at $2.01 as of 3:40 a.m. EST. This movement occurred alongside a 4% surge in trading volume, reaching $4.15 billion.
The decrease in the Ripple token's price coincides with the approaching launch of the fifth XRP ETF. The Cboe has approved 21Shares' new product, which will trade under the ticker TOXR.
This approval, detailed in an SEC filing, still includes a "delaying amendment," indicating that the fund awaits final clearance from the SEC.
BREAKING: 🇺🇸 @21shares$XRP ETF Approved By The CBOE Under Ticker TOXR! 🙌 pic.twitter.com/vT9PdPCPD1
— Good Evening Crypto (@AbsGMCrypto) December 10, 2025
The 21Shares TOXR fund is set to have an annual sponsor fee of 0.3%. Ripple has initially funded the ETF with 100 million XRP, valued at approximately $226 million. The fund will permit creation and redemption through in-kind XRP transfers or cash settlements.
Collectively, US spot XRP ETFs have seen inflows of nearly $954 million in less than a month, positioning XRP as the fastest-growing crypto ETF category, according to Ripple CEO Brad Garlinghouse. Despite volatile trading conditions, these funds have not yet reported net outflows.
👀<4 weeks, and XRP is now the fastest crypto Spot ETF to reach $1B in AUM (since ETH) in the US.
With over 40 crypto ETFs launched this year in the US alone, a few points are obvious to me:
1/ there’s pent up demand for regulated crypto products, and with Vanguard opening up…
— Brad Garlinghouse (@bgarlinghouse) December 8, 2025
Network Activity and Price Correlation
The XRP network's activity demonstrates a strong correlation with its price movements. The number of active addresses, represented by green bars, typically rises during significant price rallies and declines during consolidation periods. Historically, substantial increases in active addresses occurred in early 2018, mid-2020, and late 2024, each aligning with notable price gains.
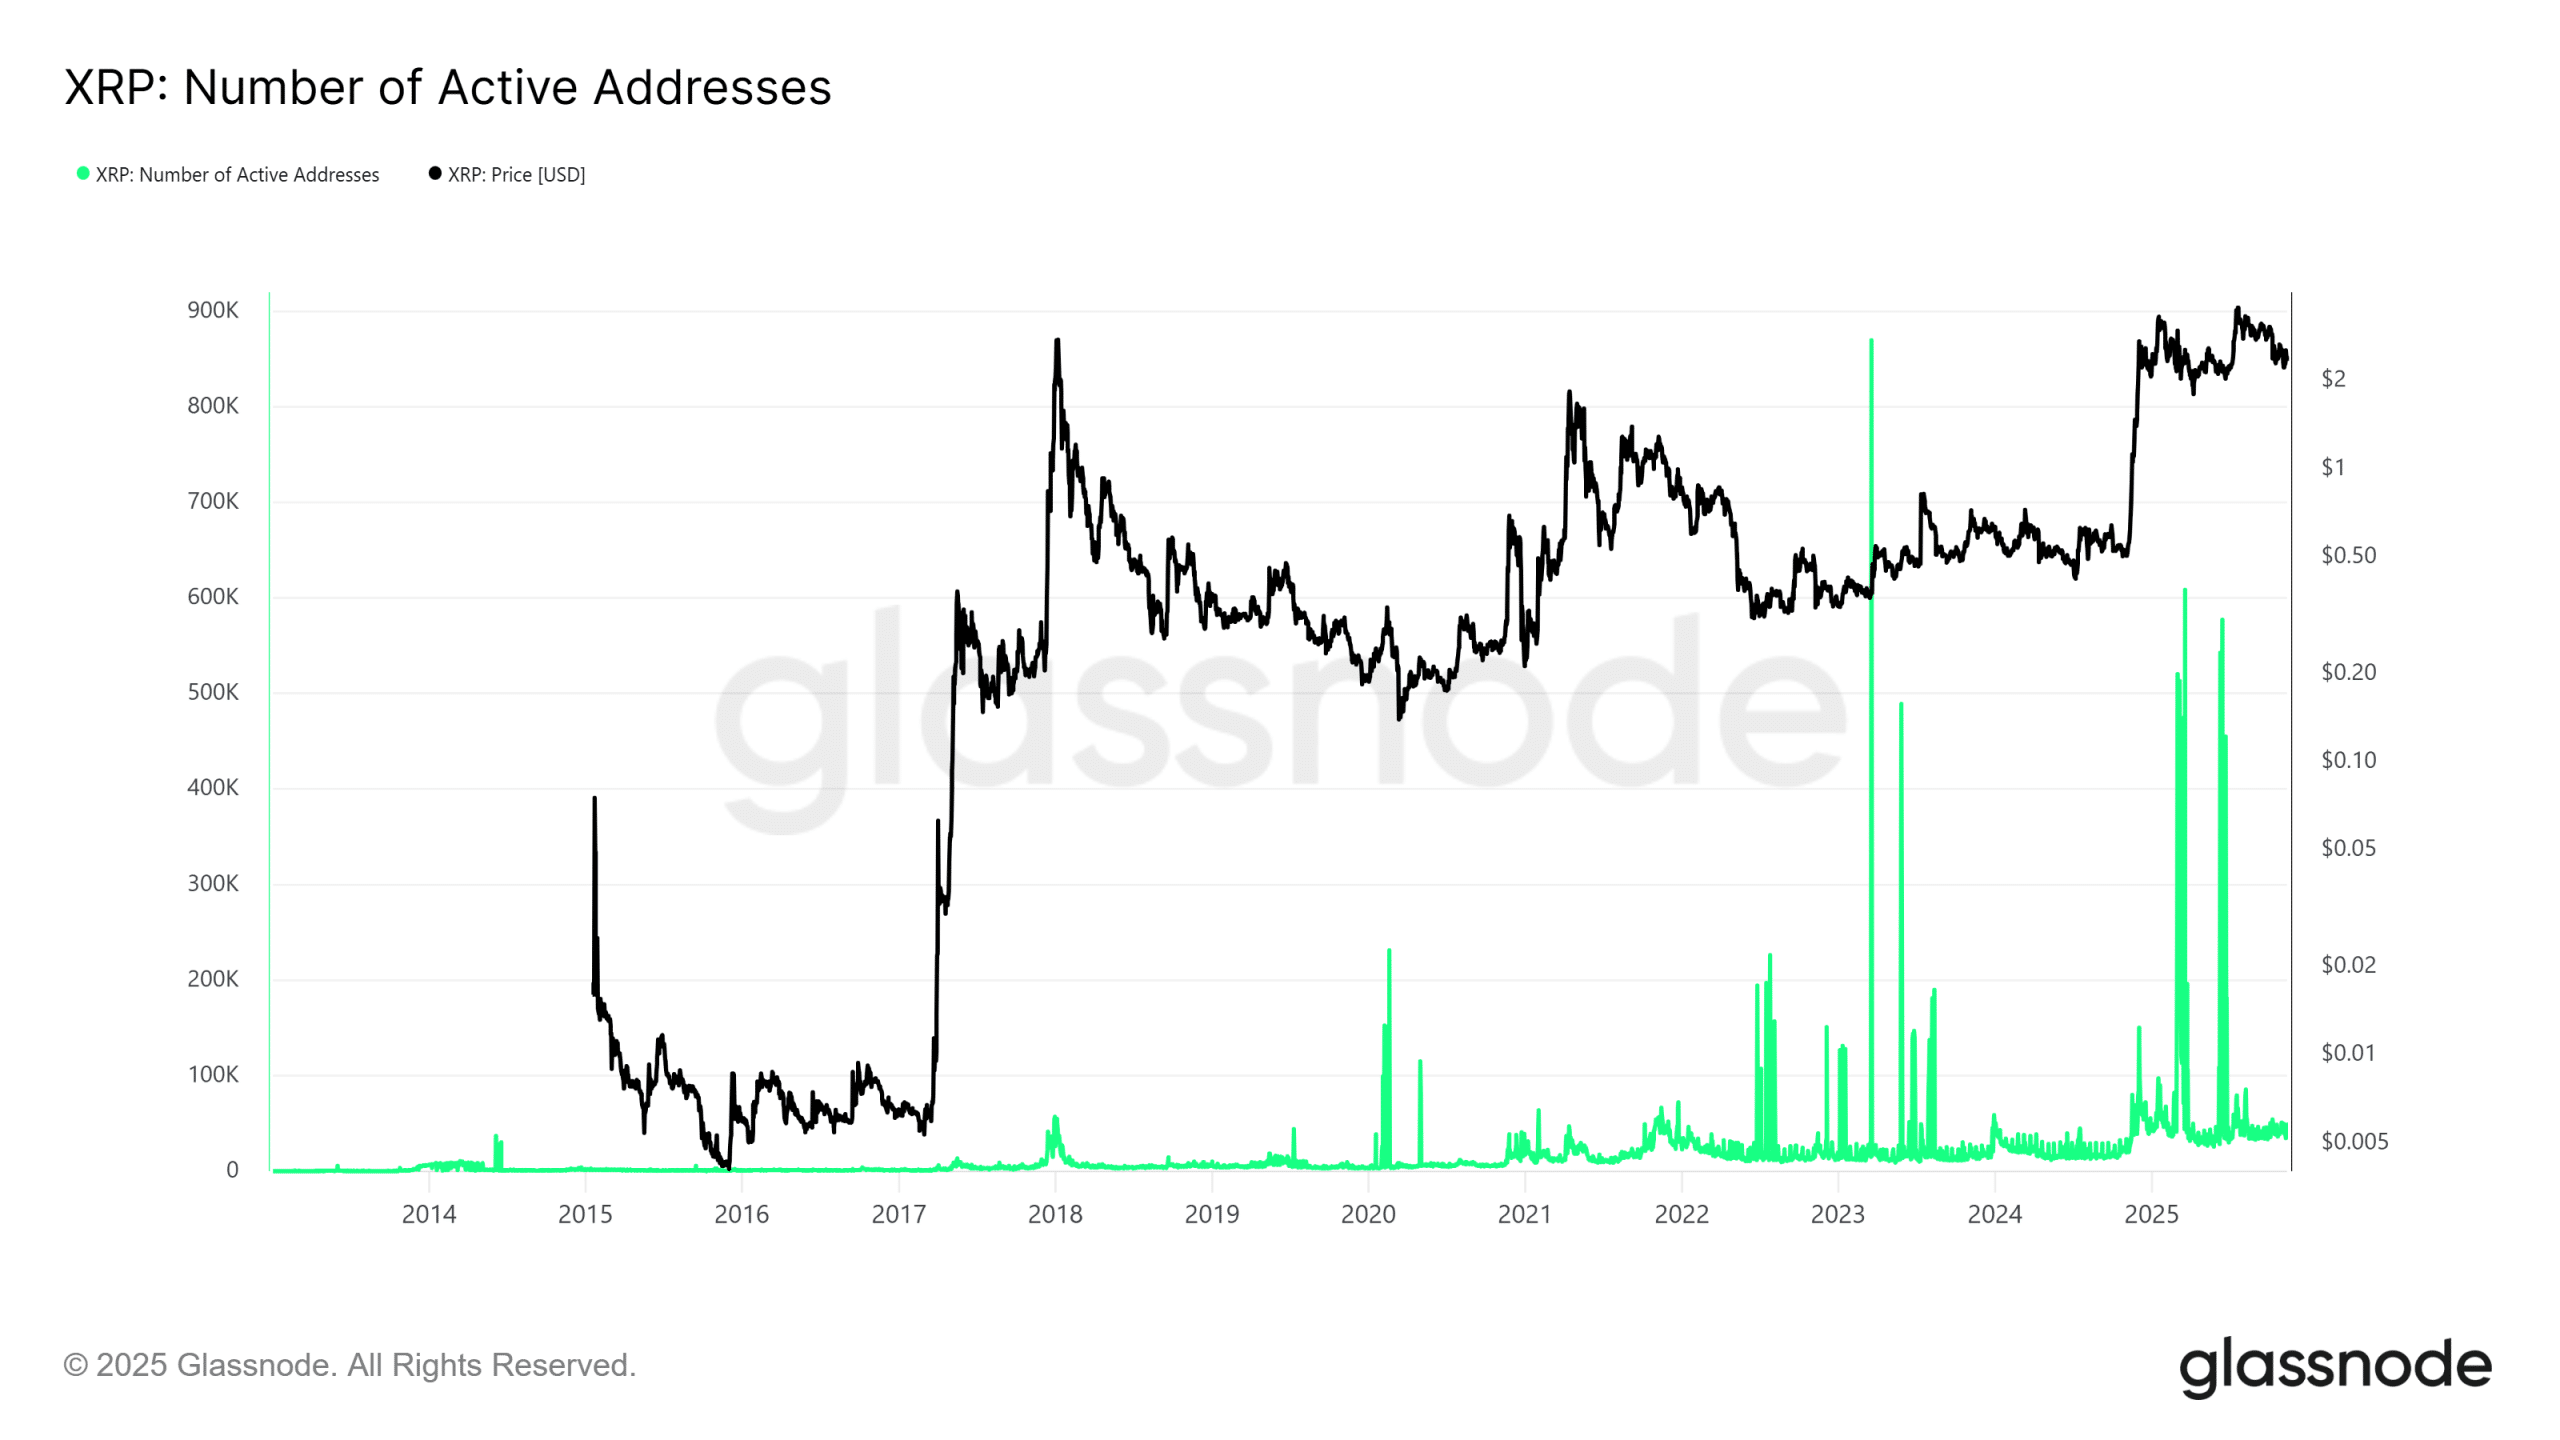
Periods characterized by low activity have often corresponded with price stagnation or declines, indicating reduced user engagement. Currently, active addresses have remained at higher-than-usual levels, suggesting sustained interest in the network. Analysts propose that if this level of activity persists, it could provide support for the price and signal healthy adoption.
XRP Bearish Trend Continues, Short-Term Relief Rally Possible
XRP has been experiencing a consistent downtrend since mid-November 2025 and is currently trading around the $2.01 mark. The price recently tested the 200-period Simple Moving Average (SMA) near $1.80, which serves as a strong long-term support level.
The 50-period SMA is positioned above the current price at $2.72, reinforcing the medium-term bearish trend. Any potential upside recovery might encounter resistance at the 50-period SMA and the upper Bollinger Band, which is situated near $2.49.
XRP is trading close to the lower Bollinger Band at $1.88, suggesting that the asset is oversold. Historically, prices often revert towards the middle band, indicating a potential short-term bounce towards $2.19, which is close to the 14-period SMA. However, the wide Bollinger Bands signify elevated volatility, implying that any rebound could be limited if selling pressure persists.
The Relative Strength Index (RSI) is currently at 36.78, slightly below the neutral level, indicating oversold conditions but also leaving room for further downward movement. A breach below $1.89 could lead XRP towards the next significant support level at $1.73, which corresponds to the 0.618 Fibonacci retracement of the recent rally from $1.73 to $2.93. On the upward trajectory, a successful bounce above $2.20 could attract buyers towards the 0.382 and 0.5 Fibonacci levels at $2.37 and $2.48, respectively.
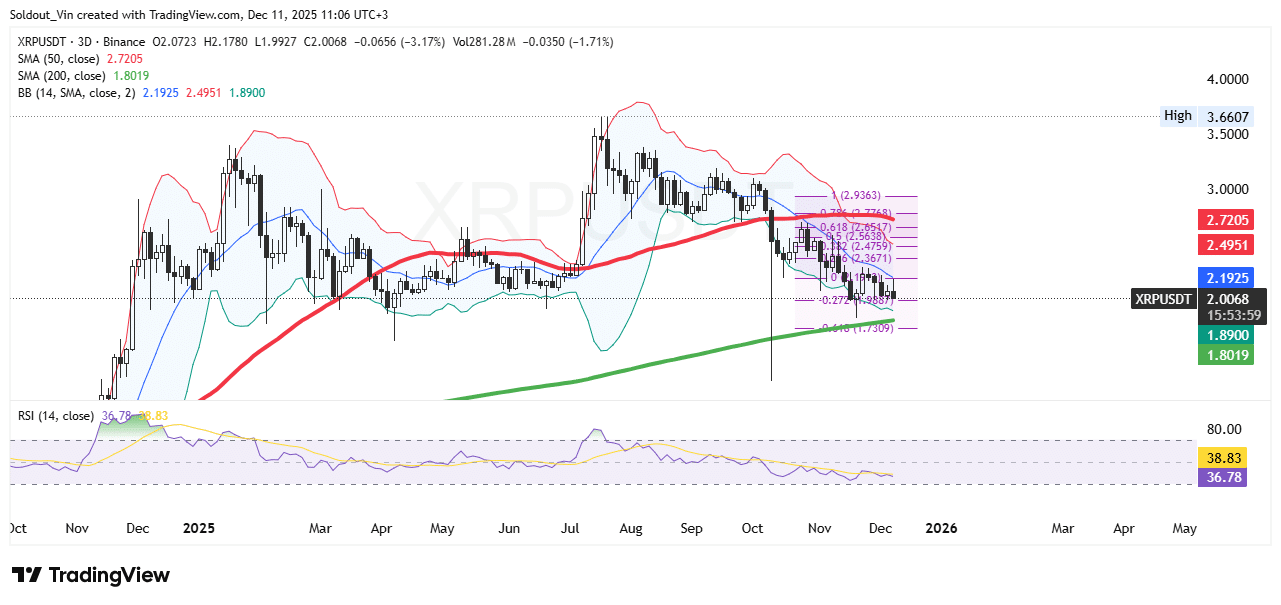
Trading volume has remained stable, hovering around $280 million, which suggests neither panic selling nor strong accumulation is occurring. Traders are advised to proceed with caution, as XRP is currently within a bearish consolidation zone where false breakouts are a possibility.
Swing traders might look for confirmation of a reversal by observing a break above $2.37 or a sustained hold above the 200-period SMA. Conversely, a failure to maintain support at $1.89 could accelerate the decline towards $1.73 and potentially the psychological support level near $1.60.
While XRP maintains a bearish outlook in the medium term, current short-term oversold conditions suggest a potential for a relief rally. Key levels to monitor include resistance zones between $2.20–$2.48 and support areas between $1.89–$1.73. Traders should closely observe volume and RSI indicators for signs of trend exhaustion or continuation before making new positions.