
Key Insights
- •Zcash (ZEC) price is experiencing the impact of a liquidity squeeze following its significant rally earlier this year. A breakout above the $380 – $430 level could potentially initiate a rally towards $500.
- •The privacy coin has recently undergone a sharp reset, with aggressive long positions that fueled the previous rally being flushed out during the decline towards $300.
- •The ZEC price chart, observed over a 12-hour timeframe, is beginning to show bearish signals after a period of strong performance in recent weeks.
Zcash (ZEC) price is currently feeling the pressure of a liquidity squeeze, a consequence of its substantial rally earlier this year. Analysts observe that the market has transitioned from consistent buying to consistent selling, a shift clearly reflected in the current chart patterns.
The earlier unsuccessful attempt to break above the $380 mark served to confirm the location of major resistance. Traders monitoring market flows indicate that significant sellers are actively participating on every price bounce.
These seller orders are effectively capping any upward movement, confining ZEC within a narrow and tense trading range. While the coin is not experiencing a collapse, it is also not recovering; it remains caught between fatigued buyers and determined sellers.
Zcash (ZEC) Price Faces Key Resistance at $380 – Can Bulls Reclaim Control?
Analyst Ardi noted on X that whales attempted to stimulate a rebound by generating positive delta, but their bids were insufficient to counter the substantial liquidation pressure engulfing the market. Ardi highlighted that the imbalance was evident, with approximately three sellers emerging for every buyer.
He further commented that the price zone around $380 for Zcash (ZEC) has become a trap for bullish traders anticipating a breakout. Each movement towards this level attracts fresh selling pressure, providing larger holders with an opportunity to reduce their exposure during brief rallies.
According to Ardi, ZEC will remain vulnerable as long as it trades below this resistance barrier. Whale bids risk becoming mere exit liquidity for bears until the market can successfully reclaim this resistance level.
Concurrently, Zcash has just experienced a significant reset. Aggressive long positions that propelled the last rally were flushed out during the sharp drop towards $300, resulting in a cleaner and more balanced market. The chart's focus now shifts to a single critical level: $380. If the price can successfully break above $380 and sustain this position, the market sentiment is likely to change.
The technical structure would revert to a neutral state, and short sellers who positioned themselves prematurely could face a rapid squeeze, potentially driving the price into the $420 supply zone. This particular pocket has historically acted as strong resistance, and a move into it would signify that buyers have begun to regain control.
Conversely, a rejection at the $380 level would convey a considerably different message, suggesting that the existing downtrend still has momentum and room to continue. Below the current trading range, a cluster of trapped dip-buyers exists in the $250–$290 zone; these are traders who entered the market too early and are currently at a loss.

The market typically punishes early accumulators. If ZEC fails to break through $380 once again, the path downwards will open, and the price could drift lower to clear out the remaining weak long positions.
Zcash (ZEC) Price Prediction: Breaking $430 Could Trigger a Move Toward $500
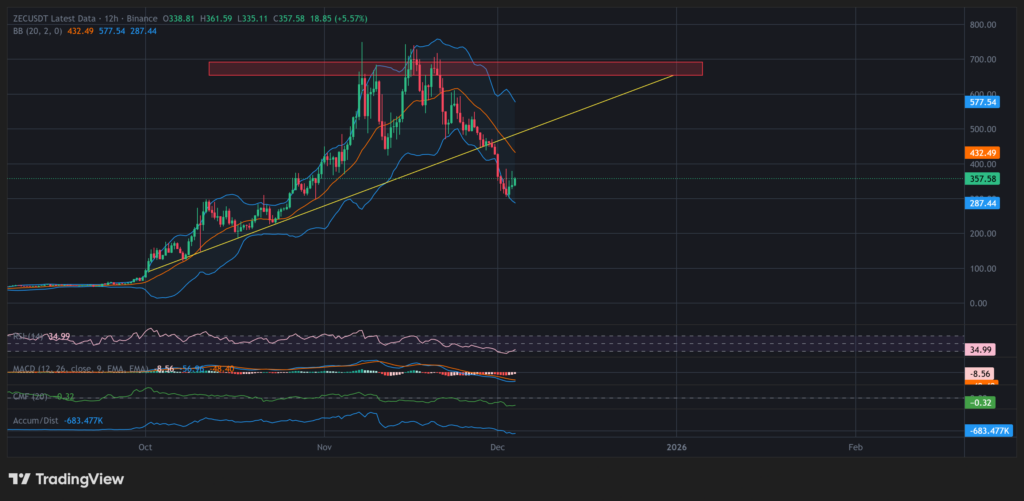
The ZEC price chart, observed over a 12-hour timeframe, is showing a bearish inclination after several weeks of strong performance. The trendline that supported the last rally has been broken, and every subsequent bounce has been weak. Analysts indicate that the technical indicators reflect this hesitation; momentum tools are positioned low with no clear directional bias. Volatility has also tightened within the Bollinger Bands following a prolonged decline.
Above the current price, the $430–$577 zone remains the broader supply area that previously halted ZEC’s parabolic ascent. This significant resistance zone has not been tested during the recent rebound, suggesting that sellers continue to maintain the upper hand.
For the time being, bears are successfully defending the breakdown level, and analysts perceive no indication that this selling pressure is diminishing.
Zcash (ZEC) Price Fundamental & Technical Outlook Point a Positive Picture
The decline of Zcash (ZEC) price from $700 to $300 bears a resemblance to Bitcoin’s crash in 2013–2014, but it is unfolding at a considerably faster pace. Analysts note that both charts are following a similar pattern: the price builds a base, experiences a sharp breakout, and then retraces as liquidity diminishes. The rhythm is almost identical, with only the speed differing. What took Bitcoin months has been compressed into weeks for ZEC.
The underlying drivers of these moves also differ in a significant way. Bitcoin's collapse was attributed to weak infrastructure and low liquidity at the time. Zcash's decline, however, stems from other factors entirely—a thin float, rapid unwinding of leverage, and algorithms reacting to a sudden liquidity vacuum. Consequently, analysts suggest that this is not a supply-side issue but rather a liquidity shock, which tends to reverse more rapidly.
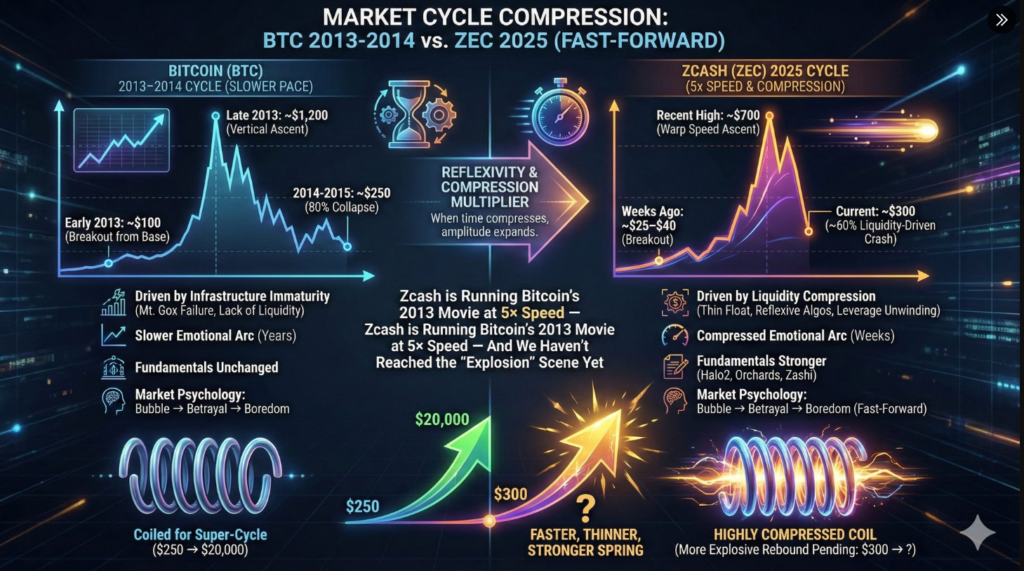
Despite the significant pullback, Zcash's fundamental aspects remain unchanged. Developers continue to implement upgrades, the circulating supply remains tight, and interest from the Bitcoin privacy community is growing. The psychological cycle that took Bitcoin years to complete has already played out for ZEC in a matter of weeks, suggesting that the next major price movement could occur sooner than many anticipate. The last time a similar technical structure emerged, Bitcoin went on to fundamentally redefine its narrative. Analysts observing ZEC argue that an analogous setup is currently forming, albeit in fast-forward.