

ZEC trades near a crucial technical zone after losing two important supports, raising attention among traders assessing whether the latest decline signals further downside or a possible recovery setup.
ZEC Tests Final Support After Key Breakdown
ZEC as of writing sits at $471.88 after a 7.67% daily decline and a 28.23% weekly drop. The move places the asset directly on the 38.2% Fibonacci retracement that supported the previous rebound earlier in the month. This level acted as the base for the strong surge toward the upper range near $700.
Analysis indicates that ZEC lost the SMA-50 and the $480 zone in the last sessions. Both levels were previously held as reliable supports and helped maintain a neutral range structure. Their failure introduces a different market tone as price now rests on the final area that held the uptrend.
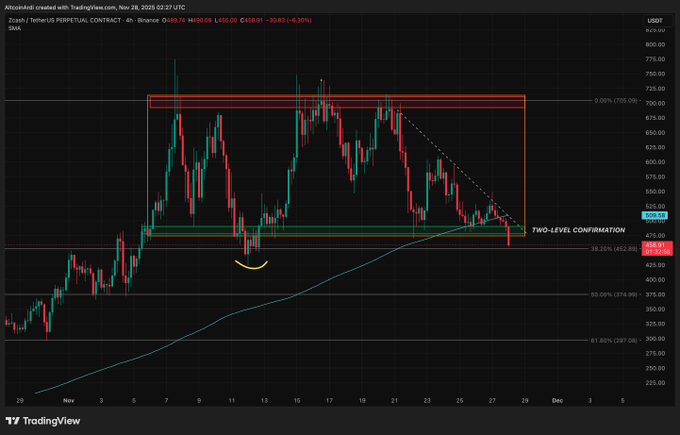
Multiple closes below the 38.2% retracement would confirm a structural shift. This would expose liquidity areas near $410–$425 and a deeper pocket around $370–$380. These levels match earlier imbalances created during the rapid expansion phase in early November.
Two-Level Confirmation Develops at $480
A two-level confirmation at $480 has been described, where a descending trendline meets former support. This creates a combined technical barrier that now behaves as resistance. A return through this level would carry meaning, as it would indicate buyers reclaimed momentum.
If price recovers above the trendline and $480, the recent move may resemble a liquidity sweep. Such events occur when price briefly breaks a key support before reversing back into the prior range. A sweep often triggers renewed activity from sidelined spot buyers.
The long consolidation zone between $480 and $700 remains the broader map for ZEC short-term structure. A return above $480 would push the asset back into this range and open the mid-level near $575 as the next upside checkpoint.
Funding Rate Trends Reflect Shifting Market Posture
ZEC’s OI-Weighted Funding Rate chart shows several sentiment phases. Early September trading held near neutral, with price contained around the lower $300 range. This period reflected balanced positioning with limited volatility.
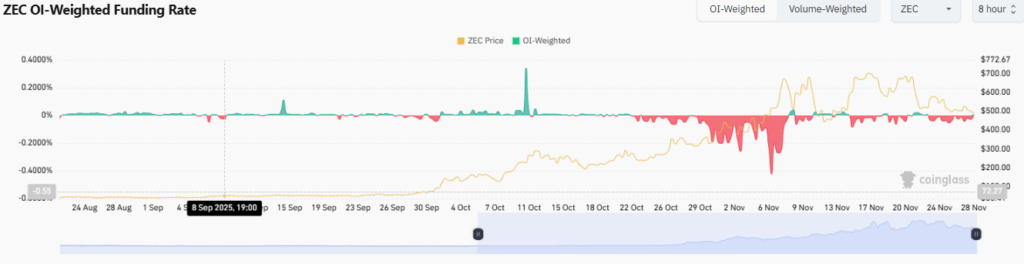
Funding turned negative during October as price climbed toward the mid-$400 zone. This pattern suggested spot demand was stronger than leveraged supply, allowing price to rise despite short pressure. Brief spikes in positive funding appeared during sharp intraday rallies, but they faded quickly.
During the November advance toward $700, funding remained heavily negative. This signaled persistent short positioning even as price expanded. The recent return toward neutral funding coincides with the current pullback, indicating positioning reset as ZEC tests a decisive technical zone.